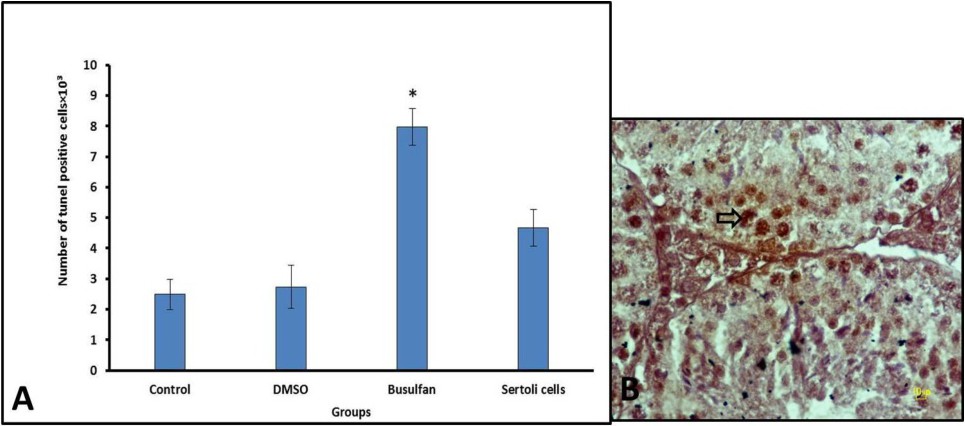
Fig. 9. (A) Total number of apoptotic cells in the different groups is shown. The significant difference between busulfan groups in comparison to the control and DMSO groups is indicated. *p<0.01. (B) Representative microphotographs of Tunnel assay. Tunnel detection of apoptotic cells in testes. Tunnel-positive cells are stained in brown (Arrows).